At Bramshill Investments we manage absolute return solutions in fixed income and income-producing assets. Our philosophy of relative-value investing in income-producing securities leads us to evaluate yield relative to the underlying risks. Essentially, we are on the constant search for quality yield.
For several of our RIA and family office clients, Bramshill portfolio managers serve as an accessible resource for market insights on RIA’s underlying fixed income allocations. In that role, we urge clients to reevaluate the quality of the yield they are implementing in client portfolios; in other words, consider the risk reward of each fixed income investment.
During Q4 2016, the team at Bramshill wanted to help more investors recognize the dangers of reaching for yield, so we launched a series of blogs dedicated to helping RIAs better analyze quality yield within fixed income investments. We teed up five blogs covering five different metrics for income investors to consider, and we covered some pretty cool and interesting ways to view yield relative to risk.
- Yield relative to Duration
- Yield relative to Credit Quality
- Yield relative to Liquidity
- Yield relative to Max Drawdown
- Yield relative to Volatility
Below are a few highlights from each of the individual blogs:
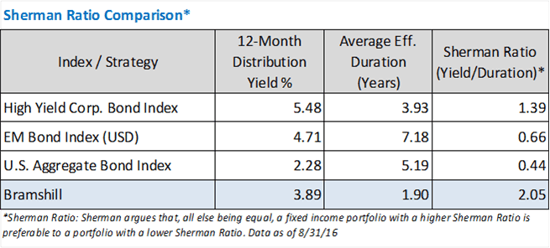
“The Sherman Ratio”: While it appears on the surface to be a simple metric, it is immensely valuable in a rising rate environment. The Sherman Ratio measures the amount of interest income generated relative to the interest rate risk being taken. Essentially, yield/duration measures the breakeven point at which falling bond prices will overwhelm the interest income thereby resulting in a capital loss (i.e. the percentage increase in rates that will wipe out the yield).

Credit Risk: Macro influences, courtesy of the central banks, have created an environment of complacency - especially when it comes to credit quality. The passive investor doesn’t appear to care about good or bad fundamentals…they own everything. Actively managed bond mutual funds have routinely allocated to the riskiest securities in an all-out scramble to beef up their advertised yield with hopes of attracting inflows from yield-starved investors. Together, the flows into yield-enhancing strategies have been massive. However, with complacency, comes risk.
Liquidity: When markets are rallying and things are going well, many investors ignore liquidity risk. For starters, it can be difficult to analyze and difficult to quantify. The standard measures of bid/ask spreads, dealer inventory levels and trading volumes are certainly useful. Understanding what impacts liquidity – characteristics of the security, urgency of buyers/sellers and transaction size – is also helpful. This analysis can get a bit more complicated with regards to active vs passive and ETF strategies as investors need to consider primary liquidity (i.e. liquidity of the underlying securities) and secondary liquidity (i.e. “on screen” liquidity). Importantly, we believe investors should also consider current market conditions. This is important because bond market liquidity is cyclical. It is affected by monetary policy, dealer financing, investors’ risk appetites, issuance cycles, etc.
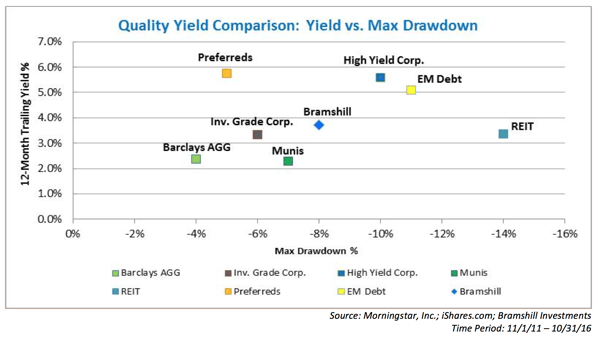
Drawdown: The chart below plots the current twelve-month trailing distribution yields relative to the maximum drawdown that has occurred over the last five years. The asset classes below are represented via the iShares ETFs and are used solely as a proxy for estimating the downside risks of potential asset classes. In no way is this meant to be an exhaustive analysis. Rather, we hope it can be used by RIAs and financial advisors in meetings with clients as you discuss the risk reward options in fixed income for 2017.

Volatility: Standard deviation is a widely recognized measure of volatility. The usefulness of this risk measure, however, is in assigning probabilities. According to the laws of normal distribution, we know that 68% of the time, future returns should fall within 1 standard deviation of the mean, and 95% of the time, we will experience returns within 2 standard deviations of the mean. This provides a useful tool in gauging the potential future experience of any asset class or security. The application of this is important in the context of an RIA’s end-client, especially for those heavily allocated to fixed income. If standard deviations were to rise substantially (they increased 2-3x’s during the 2008 crisis and 1.5-2x’s during the 2013 taper tantrum), increased volatility could easily overwhelm the income currently being offered and significantly impact total return.
At Bramshill Investments, we believe now is a prudent time to review your bond allocations and specifically, the yield required relative to the risk of the underlying asset class. In building portfolios for our RIA, family office and institutional investors, we embrace the philosophy that active management and tactical asset allocation in fixed income makes more sense now than it has in a very long time.
We hope that you have found this blog series on quality yield to be insightful as you reanalyze your bond portfolio in the context of the risk reward options in fixed income for 2017.
Please feel free to contact the team with any questions or comments.

This commentary is provided by Bramshill Investments, LLC for information purposes only and may contain information that is not suitable for all investors. Certain views and opinions expressed herein are forward-looking and may not come to pass. Investing involves risk, including the potential loss of principal. Past performance may not be indicative of future results, which are subject to various market and economic factors. No statement is to be construed as an offer to sell or solicitation to buy securities or the rendering of personalized investment advice. Bramshill does not provide investment advice with respect to individual holdings or portfolios outside of the assets and accounts for which the Firm has been engaged to manage.


