We love analyzing sector flows within the bond market. It removes the noise of the talking heads and reveals how investors are actually allocating their fixed income portfolios. Below we review the flows of various bond sectors as represented by the iShares ETFs. The source of flows captures different types of investors including retail, RIA/family office and institutional; along with the various reasons for utilizing ETFs (hedging, sector rotation, diversification, etc.). As active fixed income managers, we understand there is a place for passive investment strategies, though at this time, we see very poor risk-reward dynamics of indexing in the current rate environment. With wealth managers in mind, we hope the accompanying flow data helps you to better understand the positioning of other market participants.
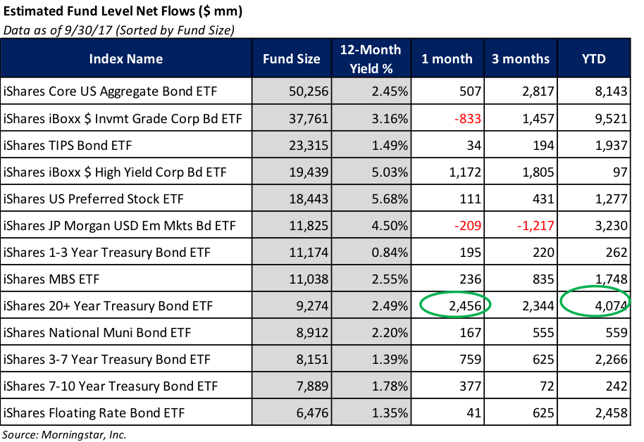
The visual below contains a number of sectors (even those outside the scope of Bramshill’s universe) and while certainly not all encompassing, it exposes some very interesting actions on behalf of fixed income investors.
For example:
- The most surprising revelation was the activity in the 20+ Year Treasury Bond ETF. YTD net inflows are estimated at +4.0 bn with almost +$2.5 bn allocated in the month of September alone! This brings total AUM to just over $9 bn with roughly 44% of that AUM allocated during the course of 2017. This is mind boggling. With a yield of only 2.49% and duration of +17, it is hard to fathom why investors find this sector attractive. After all, in a rising rate environment, this security will experience serious drawdowns. Just look at 2016. The 10 Year Treasury rate moved up +96 bps which resulted in a drawdown of -12.64% for this ETF. Last month, same story. 10 Year rates moved up +26 bps from a low of 2.06% to high of 2.32% and the 20+ Year Treasury lost -2.26%. It will be interesting to see how long these investors will tolerate rate volatility and the risk of continued drawdowns.
- EM Bonds saw -$1.2 bn of outflows during Q3. This partially reversed a strong year of inflows which saw roughly +$4.5 bn of net new assets allocated through 2Q 2017. The Q3 outflows are fairly surprising considering the sector was a strong performer during the 1H of 2017 with a return of 6.00% through 6/30. Since 6/30, the sector returned another +2.63% bringing the YTD return to 8.79% as of 9/30.
- High Yield investors creeped back into the market with +$1.8 bn of net inflows during Q3. This reversed the -$1.7 bn of outflows during the 1H of 2017. Even with the manic flows, the sector has performed quite well this year returning +6.06% YTD as of 9/30.
With only one quarter remaining in 2017 and the potential for higher interest rates and the Fed balance sheet unwinding, we suspect asset flow volatility will be on the rise.
This commentary is provided by Bramshill Investments, LLC for informational purposes only and may contain information that is not suitable for all investors. Certain views and opinions expressed herein are forward-looking and may not come to pass. Investing involves risk, including the potential loss of principal. Past performance may not be indicative of future results, which are subject to various market and economic factors. No statement is to be construed as an offer to sell or a solicitation of an offer to buy securities, or the rendering of personalized investment advice.


